| r_number | name | formation | system | series | interval | biota_main | biota_sec | lng | lat | country | authors | title | year |
|---|---|---|---|---|---|---|---|---|---|---|---|---|---|
| 1 | Tilkideligi Tepe | Triassic | Upper Triassic | lower Norian | Calcisponges | Stromatoporoids | 30.3833 | 37.0333 | Turkey | Riedel, P. | Riffbiotope im Karn und Nor (Obertrias) der Tethys: Entwicklung, Einschnitte und Diversitatsmuster. - | 1990 | |
| 2 | Hydra | Pantokrator Limestone | Triassic | Upper Triassic | upper Carnian | Corals | Calcisponges | 23.6333 | 37.3833 | Greece | Schafer, P., Senowbari-Daryan, B. | The Upper Triassic Pantokrator Limestone of Hydra (Greece): An example of a prograding reef complex. - | 1982 |
| 3 | Shiraho, W-Pacific | Neogene | Holocene | Recent | Corals | Algae | 124.2500 | 24.3333 | Pacific | Kayanne, H., Suzuki, A. & Saito, H. | Diurnal changes in the partial pressure of carbon dioxide in coral reef water. - | 1995 |
Introduction to the palaeoverse R package
Lewis A. Jones
Bethany J. Allen
2026-11-19
Why palaeoverse?
- Analyses rarely go straight from raw data to results
- Routine but essential tasks come first: checking taxonomic names, binning occurrences, reconstructing palaeogeography
- This code is often rewritten from scratch for every project
- This leads to duplicated effort, lost time, and ad hoc workflows that can be hard to reproduce, share, or reuse (not FAIR)
What does palaeoverse offer?
- Reusable: a few clear lines replace long, bespoke scripts
- Reproducible: consistent function names, arguments, and outputs
- Readable: well-documented, tested, and peer-reviewed functions
Design
Three design choices shape how palaeoverse functions look and behave:
- Built around occurrence data
- Modular
- Flexible
Built around occurrence data
- Most palaeoverse functions take an occurrence
data.frameas input - Each column is a different variable (e.g. identity, age, location, formation, reference)
- Each row is a single record of something present at a particular place and time
- That “something” is usually a taxon, but not always (in the
reefsdataset, each row is a fossil reef)
Occurrence data.frame
Modular
Each function in palaeoverse does one job well. You can use one on its own, or chain several together into a full workflow:
# Load library and data
library(palaeoverse)
data(tetrapods)
# Get time bins
bins <- time_bins(interval = "Phanerozoic",
                  rank = "stage")
# Bin data
bin_time(tetrapods, bins = bins, method = "mid")
# Pipe together
tetrapods |>
  bin_time(bins = time_bins(interval = "Phanerozoic",
                            rank = "stage"),
method = "mid")Flexible
palaeoverse functions are not tied to a specific source (e.g. Paleobiology Database). Column names are provided as arguments, not fixed requirements:
Applications
- Exploring and summarising data
- Cleaning and harmonising data
- Preparing data for analyses
Exploring and summarising data
palaeoverse includes functions to help users explore and understand their data better, such as calculating temporal and geographic ranges:
Temporal range
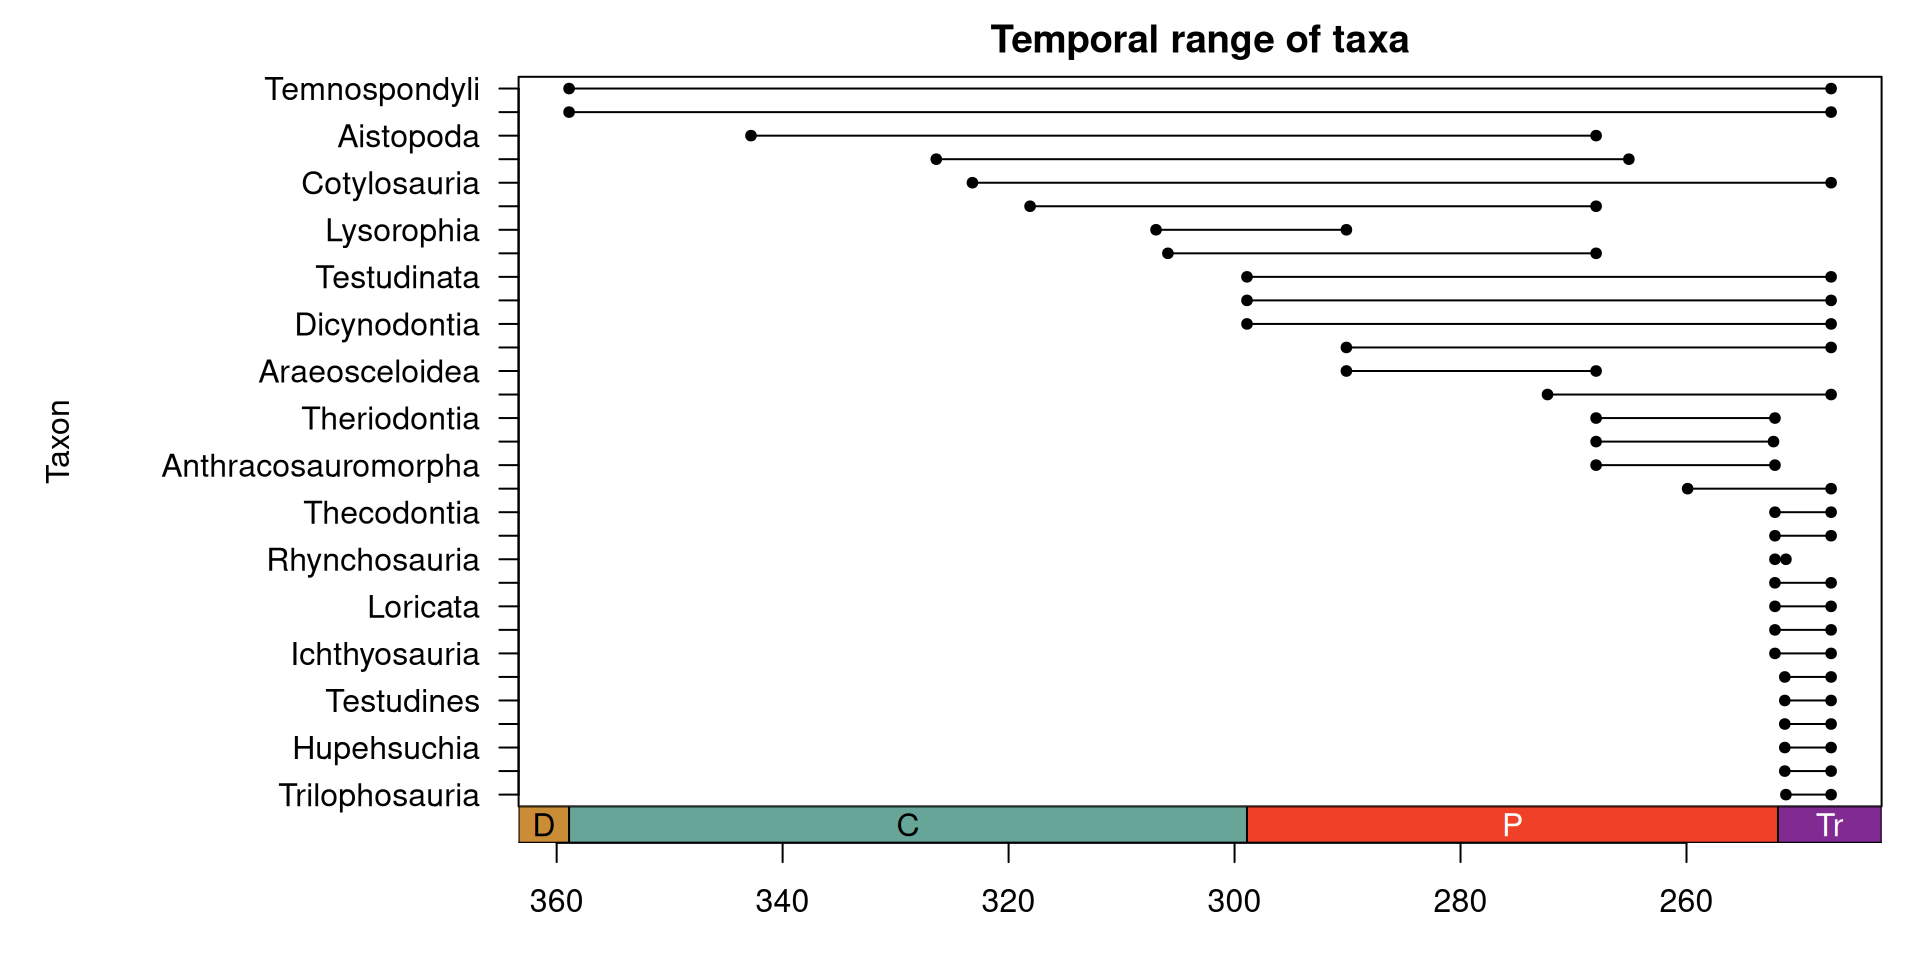
Temporal range of Carboniferous to Early Triassic tetrapods.
Cleaning and harmonising data
palaeoverse includes functions to support the cleaning and harmonising of data such as removing duplicates and checking taxonomic names:
Preparing data for analyses
palaeoverse includes functions to prepare data for analyses, such as estimating palaeocoordinates and binning data:
  bin      min      mid      max         area  area_prop
1   1 56.44269 73.22135 90.00000 4.250537e+13 0.08333333
2   2 41.81031 49.12650 56.44269 4.250537e+13 0.08333333
3 3 30.00000 35.90516 41.81031 4.250537e+13 0.08333333So, what is palaeoverse?
Think of palaeoverse as the bridge between raw occurrence data and the analytical methods you want to apply.
Getting help
- Everyone gets stuck with new tools, and knowing where to look for help is a key skill
- palaeoverse has several layers of support, from built-in documentation to community help
Package website
palaeoverse.palaeoverse.org hosts:
- documentation for every function
- vignettes (tutorials) showing example applications
- updates on new releases
- Searchable, and often easier to navigate than R help pages
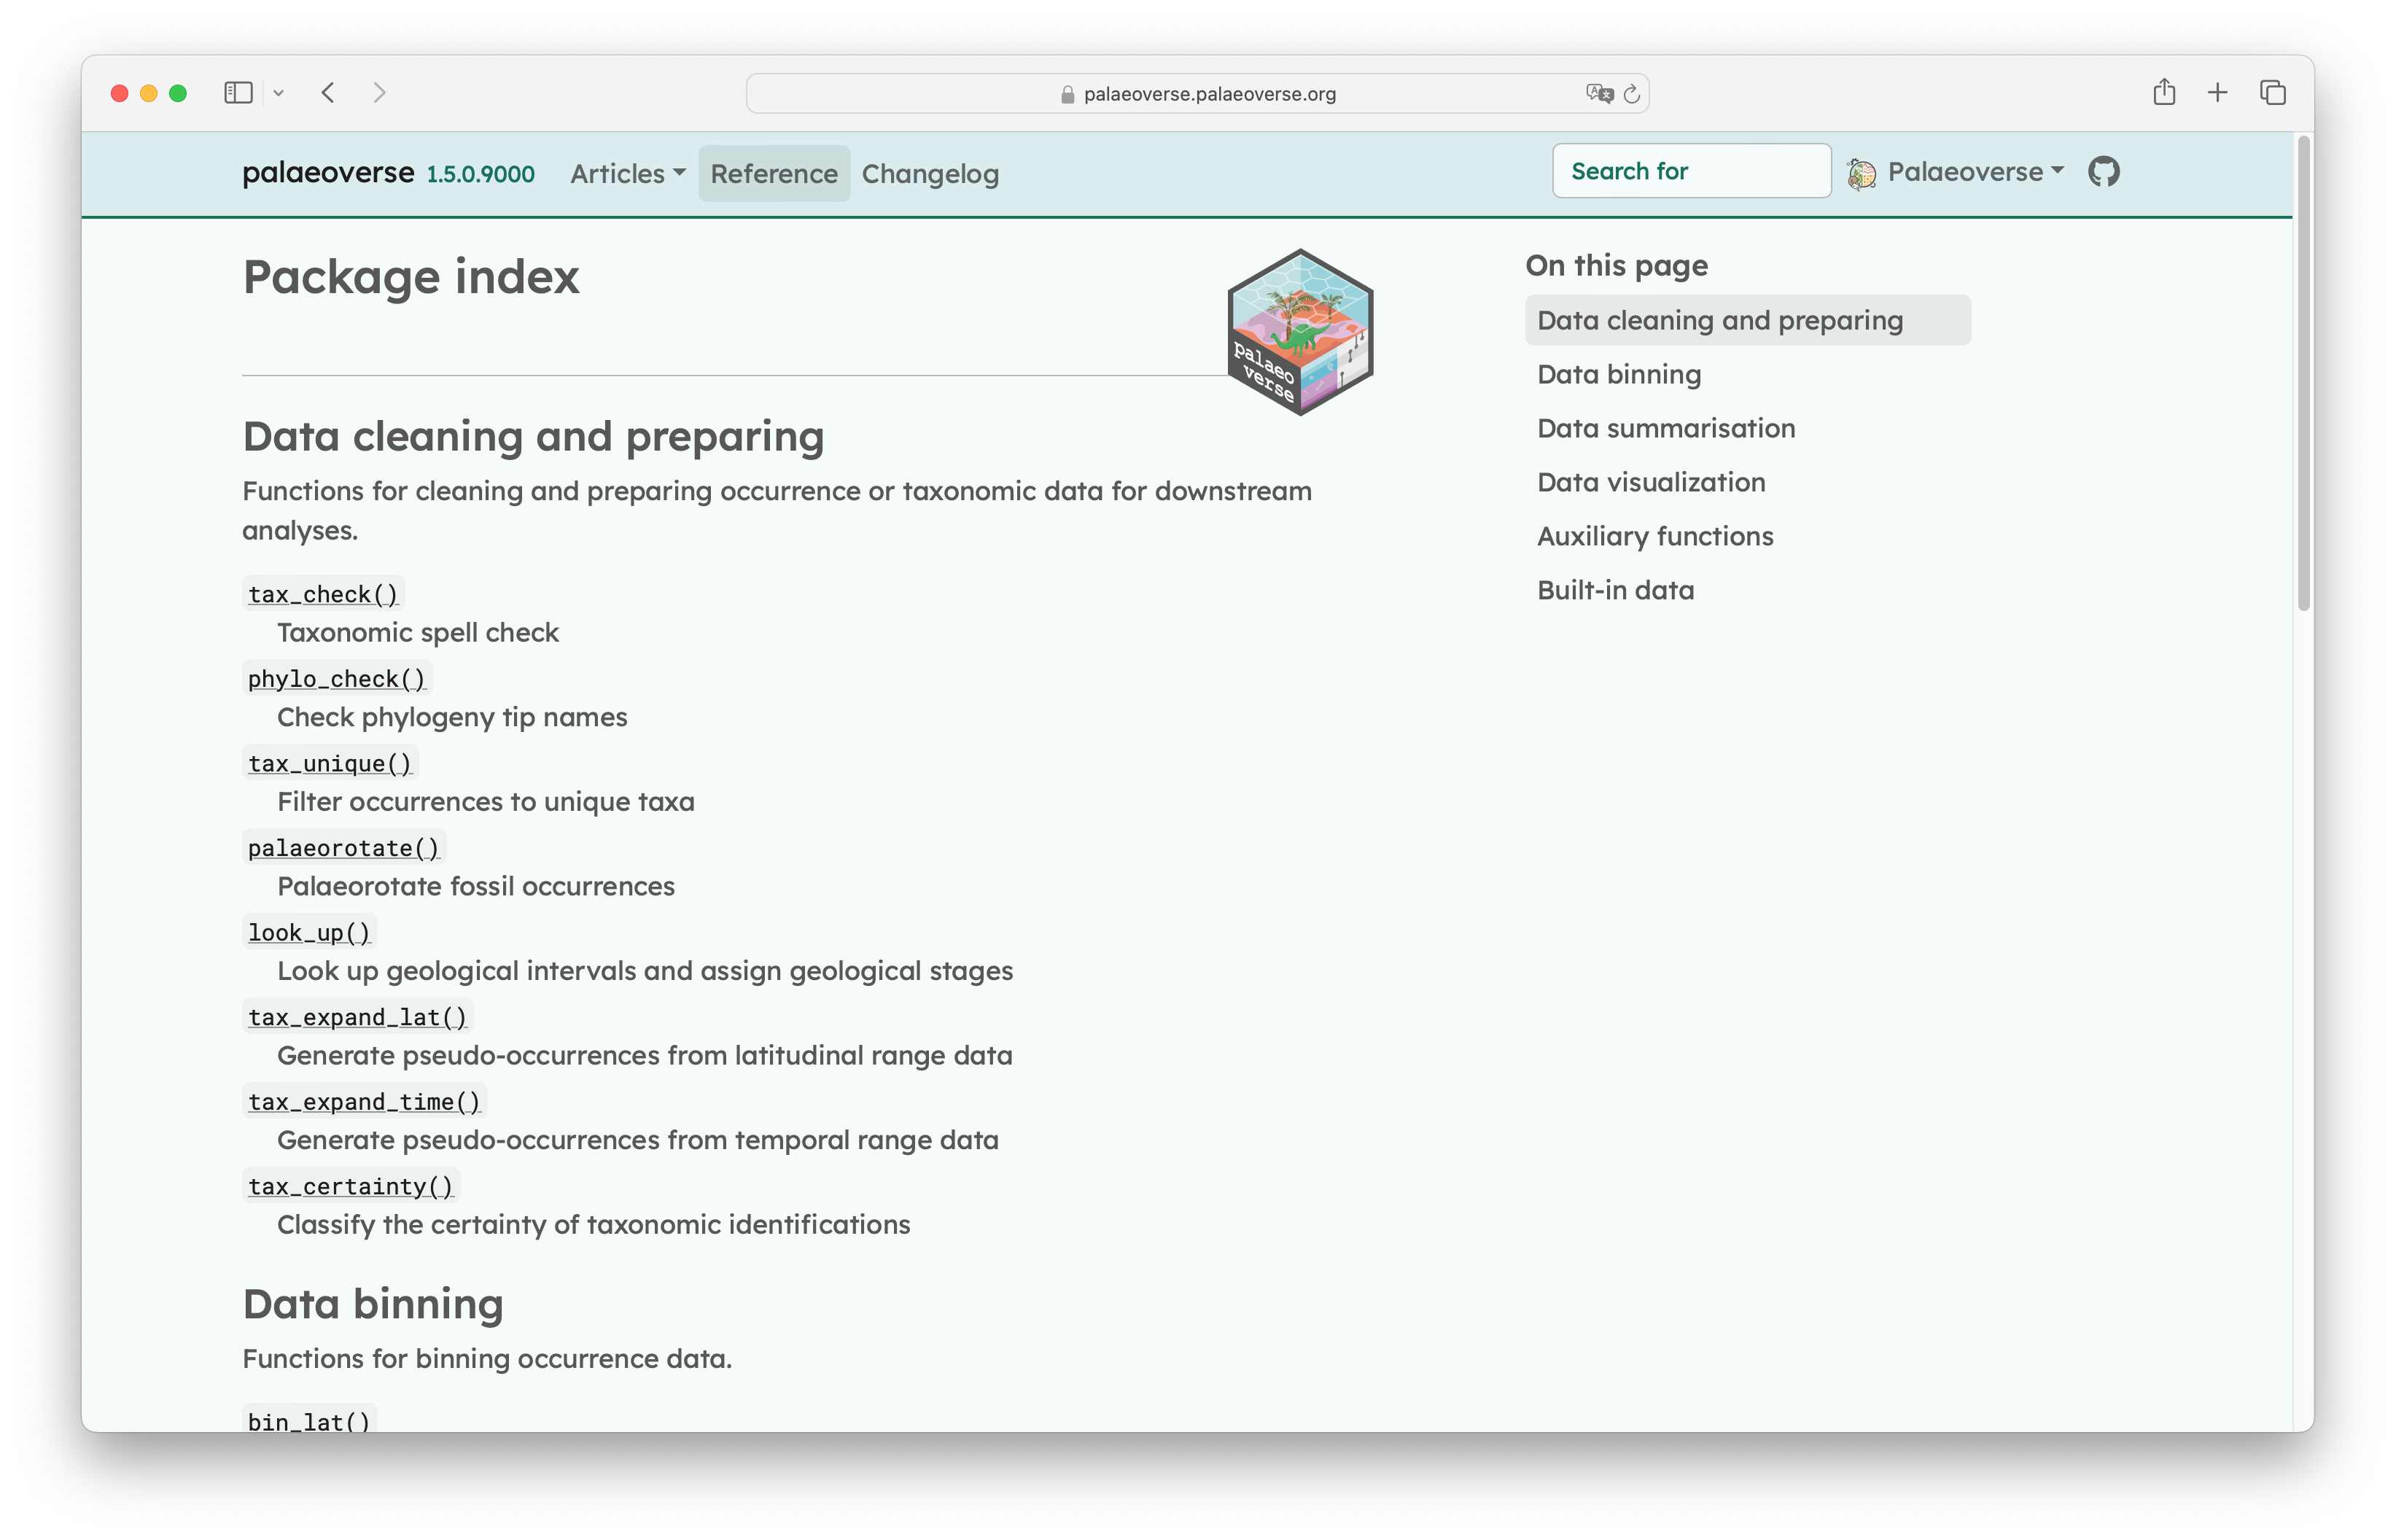
Browse all functions in our reference guide.
Still stuck?
- GitHub: search existing issues to see if your problem has been addressed
- Can’t find an answer? Open an issue with a minimal reproducible example (see reprex guidance)
- Zulip: new to GitHub? Join our Zulip and create a topic under “Help”
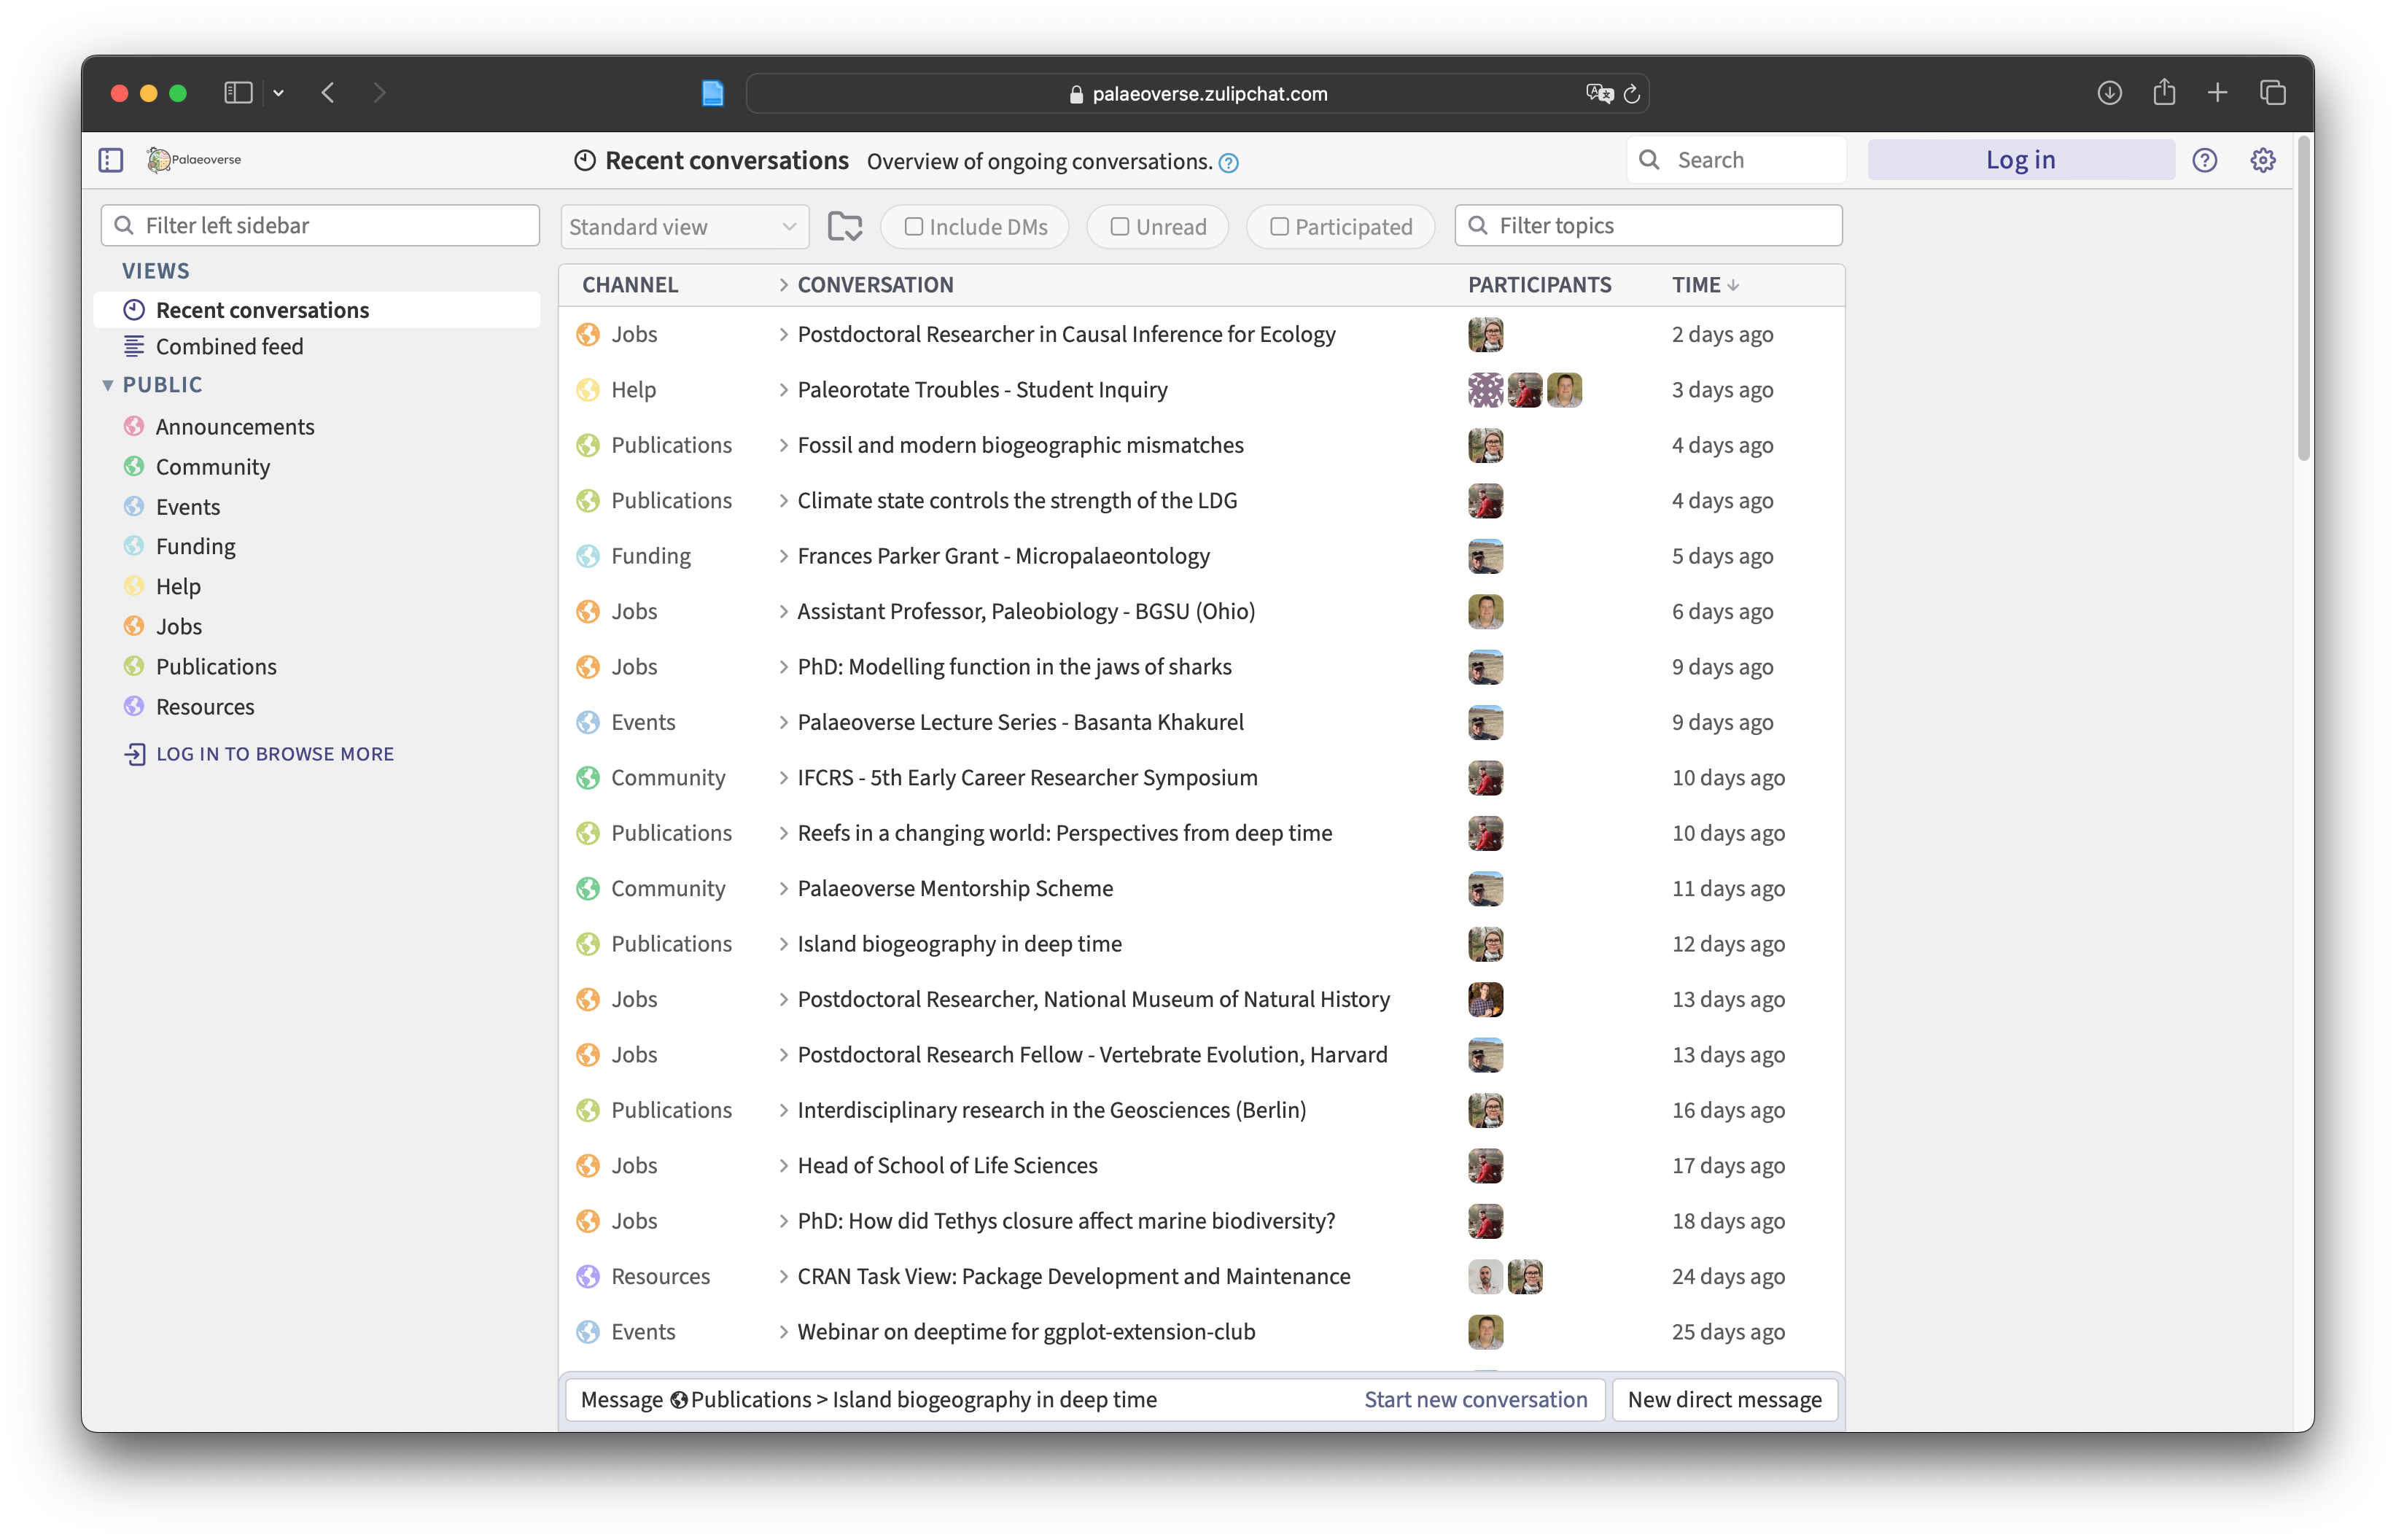
You can join palaeoverse’s Zulip and ask for help if you are still stuck after reading the package documentation.
Now, let’s get coding!
…starting with installing palaeoverse:
- Tutorial 1: Phanerozoic reefs: Investigate latitudinal trends in Phanerozoic reefs.
- Tutorial 2: Tetrapod biodiversity: Explore alpha diversity and geographic range size in Carboniferous and Permian tetrapods.